A key goal of the iSTRUM project is to better understand the microphysics of transient creep (i.e., the time-dependent change of a rock’s viscosity after changes in stress) in the upper mantle. However, as we cannot observe the flow of rocks in the upper mantle in situ, laboratory experiments remain key to informing our understanding of its transient rheological behavior. Unfortunately, there are two significant challenges to be overcome when using laboratory experiments to investigate the flow of rocks in the mantle. First and foremost of these limitations is the limitation of time. We simply cannot run experiments that last as long as the geophysical phenomena that the iSTRUM project focuses on, including postseismic creep and glacial isostatic adjustment, which occur over timescales of months to hundreds of years. Another challenge lies in the size of the samples used in our experiments. Many experimental methods rely on small samples to produce the high pressures that are characteristic of the mantle. However, to maintain a representative number of mineral grains in a small rock sample, the average grain size needs to be small (on the order of tens of micron), while the actual grain size of mantle rocks is much larger, on the order of 1–10 mm. Such small grain sizes may be problematic as many of the mechanisms by which rocks deform are sensitive to grain size, and the mechanism that presents the easiest way to deform fine-grained rocks in the laboratory may not be the mechanism that controls the deformation of the coarse-grained rocks in nature.
As we cannot perfectly replicate the conditions of the upper mantle in our experiments, we instead aim to tease out the microphysics of deformation from our experiments so that we may confidently extrapolate these physics to geologically relevant timescales and grain sizes. With this philosophy in mind, there (thankfully) are a few experimental “tricks” that we may apply to get around these time and grain-size limitations. First, we can reduce the time required to reach a geologically relevant amount of deformation by subjecting our samples to high temperatures during experiments, thereby increasing the kinetics of deformation. Second, we can apply high stresses in our experiments to overpower those mechanisms that are primarily sensitive to grain size and study those mechanisms that are primarily sensitive to stress and likely dominate at large grain sizes. Then, by comparing our experimental observations to the predictions of microphysical models we can begin to eliminate those models that fail to capture observations and refine those that match our data well.
Traditionally, transient creep in the upper mantle has been attributed to diffusion-based models. However, over the past few years, two alternative models have popularized in the scientific discourse that instead aim to explain transient creep in the upper mantle using the motion of dislocations (i.e., linear crystalline defects that facilitate deformation by moving and multiplying in response to stress). As these models predict distinct mechanical behavior, it is important to test if they actually match the behavior of olivine, the most abundant mineral in Earth’s upper mantle. One model, known as ‘the plastic-anisotropy model’, postulates that the plastic anisotropy of olivine (i.e., its directional dependence of the ease of dislocation motion) results in transient creep in mantle rocks. In this model, a stress change in the mantle first induces deformation of grains in easy orientations for dislocation motion leading to a low initial viscosity. With time, the deformation of grains in hard orientations starts to control the long-term behavior of the rock as soft grains alone cannot accommodate all deformation indefinitely. The other model, known as ‘the backstress model’, argues that it is actually the long-range interactions among dislocations and the evolution of the density of dislocations that controls the transient behavior of mantle rocks. The experiments we performed at beamline 6-BM-B of the Advanced Photon Source (APS) at Argonne National Laboratory (described in this recent paper) leveraged both of the aforementioned ‘tricks’, and enabled us to rule out one of the proposed models for transient creep in the upper mantle.
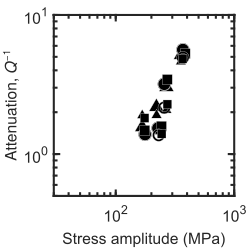
We performed high-temperature (900–1200°C), high-pressure (~5 GPa), and high-stress forced-oscillation experiments on polycrystalline olivine in a multi-anvil apparatus called a deformation-DIA. In these experiments we applied a sinusoidal force to our samples. We then used the bright X-rays produced by the APS to measure the deformation (also referred to as ‘strain’) of our samples from digital image correlation of radiographs. We measured the stress that the rock experienced by diffracting X-rays through the crystal lattice of the sample and converting the elastic lattice strains to stresses using Hooke’s law. The time delay between the imposed sinusoidal stress and the measured sinusoidal strain is directly related to a quantity known as the inverse quality factor, Q-1, that is commonly used by seismologists to quantify the attenuation of seismic waves traveling through the mantle after earthquakes. By changing the stress amplitude of the imposed oscillations we were able to observe that Q-1 increased with amplitude (Figure 1), which is diagnostic of attenuation produced by dislocations.
To confirm that the trend we observed could not be attributed to changes in grain size or crystallographic orientations over the course of our experiments, we characterized the microstructure of our samples before and after deformation by electron backscatter diffraction using a scanning electron microscope. These analyses confirmed that the evolution of grain size and crystallographic orientations could not explain our observations. Therefore, our measurements of Q-1 provide a first-of-its-kind dataset to compare to the predictions of the plastic-anisotropy and backstress models.
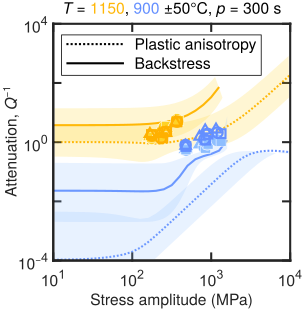
Because there are no analytical solutions to the constitutive equations of these models, we performed numerical simulations of our experiments, solving the equations for the strain produced by a sinusoidally varying stress. Figure 2 presents a comparison of the attenuation from our experiments to the attenuation predicted by the plastic-anisotropy and backstress models. The comparison clearly illustrates that the plastic-anisotropy model underpredicts the amount of attenuation observed in our experiments, especially at lower temperatures. As such, we conclude that the plastic-anisotropy of olivine did not dominate the behavior of the olivine in our experiments.